This groups discusses charts implementations in Drupal as well as information visualization examples. The holy grail for a long time has been CCK and Views integration. And now that it's here, as you can see below, many more modules with visualizations will probably soon follow.
Drupal, Charts and SUM Aggregation: 2011 and still no solution?
So I just spent the past week trying to do what I thought would be a trivially easy task for a client: Generate a View that SUMs values in fields, and turn those sums into various charts.
I am flabbergasted that there is no quick, easy, out of the box solution for this at this time. Here's what I've tried:
Drupal 6:
Google Chart API: can't label the pie slices, although aggregation is correct. This is as close as I've gotten
Charts: No aggregation
Charts & Graphs: Have to use a patched dev version of GroupBy, and then it still doesn't quite work.
Drupal 7
Read more
Need Data for Infograph
I am trying to create an infograph about Drupal showcasing its strengths and advantages, especially showing how it has grown since it's inception, numbers of modules and themes by year possibly, etc... or any other Ideas I may not have thought of. I am not a Drupal user myself(yet), so if anyone has any Ideas I would be welcome to them. If anyone has any good links to data or any data or know anyone who would have this information it would be a great help.
Read moreModule for using Fusioncharts
I have created a very simple module that is a hook into FusionCharts. I did this because I realized that the existing modules don't seem to be supported that well and because they also limit the functionality you can use from FusionCharts.
My module really requires that you build another module to access it, so it is pretty simplistic, but I'm wondering if anyone is interested in it. If so, I will look into submitting it to the Drupal repository. Please let me know what you think...
Read more
Let's Connect Drupal Chart and Graphing Initiatives
The BoF this afternoon at DrupalCon Chicago was a great success with many individuals coming forward explaining their upcoming Drupal projects that will require charts and graphs. For those comfortable sharing, I propose we post our use cases here to help connect those with similar needs who may then be able to work together. If you don't want to reveal exactly what project you're working, then a general use case will do.
Read moreBoF at DrupalCon Chicago: Charts & Graphs in Drupal Lunch. Let's share and talk about the future.
Graphing data in Drupal has been around for years in various forms but with Drupal 7 now on the scene we have some choices to make on how to move forward. All those who are interested in using Drupal to graph data, I propose we sit down and see if we can combine efforts by sharing what projects we are working on.
Even if you are not familiar with the current state of graphing data in Drupal your input is appreciated.
I hope to see you there and bring your lunch! :)
The BoF is scheduled on March 10th, 12:00 PM - 1:00 PM, in the Missouri room.
Read moreMoocharts: Animated Charts using Javascript
 Animating charts always seems to come up when talking about desired features when graphing. While animations on charts are often just a whole lot of ~WIZ~ #BANG# FLASH!, they sometimes serve a practical purpose. When trying to stick to a Javascript library this has been a common constraint, particularly on in the Flot library. Yesterday I was reading an article showing data on how movies are getting worse and I was pleasantly surprised to find MooCharts when I checked the source code of the page.
I'm wondering if anyone has used this library and hoping they could share their experience with MooCharts.
Read moreServer Side Chart & Graph generation? pChart looks nice.
 I've just finished setting up the first Beta 1 installation of Sensor Hub and it required me to port a couple months of data from an old alpha installation to the new installation. 26,000 data points that is... While I can use certain Views filters to limit the results for plotting with the Flot Charts module, I would really love to be able to see all of this data in one chart.
Flot Charts module Road Map
Last updated by R.J. Steinert on Sun, 2011-01-23 03:37
I'm hoping to get some feedback from the community who has an interest in this module and also others who have experience building features like this for graphing modules.
Everything here is also recorded in the flot_charts' issue queue: http://drupal.org/project/issues/flot_charts
project page: http://drupal.org/project/flot_charts
code: https://github.com/rj-steinert/flot_charts-for-views
These features have been determined (mostly) from the requirements for the open source Sensor Hub project (http://sensorhub.org/wiki).
Features
Group by field
http://drupal.org/node/1036818
Inspired by the views_charts module. Sort and group data on a selected Field attached to the View to generate multiple data objects for a single chart. Might need to watch out for the pager.
Map x and y axis to fields attached to the view
http://drupal.org/node/1036820
Drop the Flot Data field that has been required and just use Views UI in the Style plugin to pick which fields that have been attached to the View should be used for each axis.
x/y Min and Max exposed filter
http://drupal.org/node/1036822
Needs research. May sometimes be possible with Views filters that already exist.
Display meta about each node on mouse over
http://drupal.org/node/1036832
Display meta about each node on mouse over. The information could be from the attached fields. The style plugin could have check boxes next to each field to choose which pieces of information are included on in the tooltip.
An example module to demonstrate set up in Views
http://drupal.org/node/1036838
Export a module with Views definitions using the Features module.
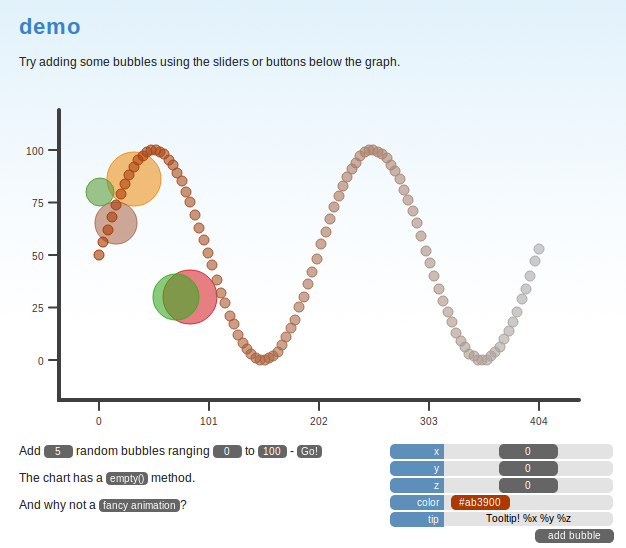
Read moreNew "Flot Charts" Style Plugin for Views lets you manually enter JSON options
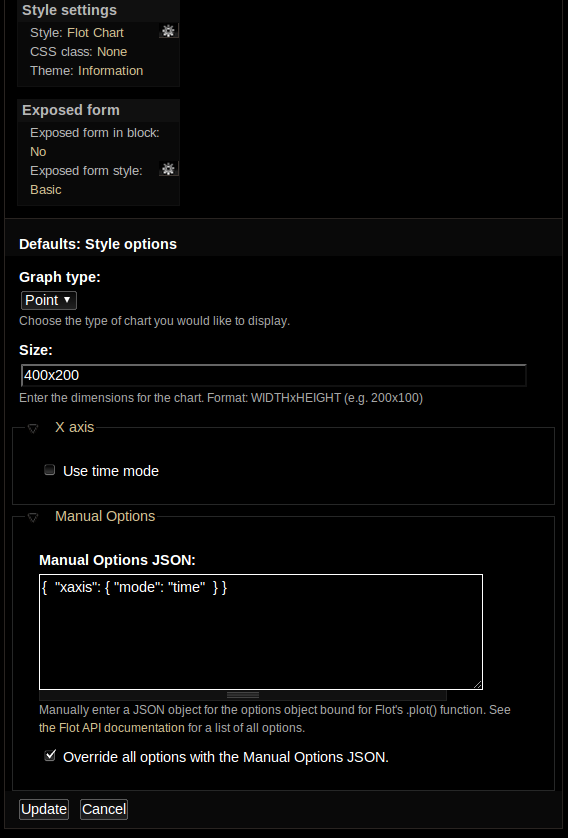 I decided to drop the flot_timemode plugin and move it in a much more flexible direction. flot_charts has the "Flot Charts" style plugin which now has a cleaner Views UI, an option for setting the x-axis to "mode: time", and for the ultimate in flexibility I've added an option for manually entering the JSON bound for Flot's option parameter in the .plot() function. "Manual Options JSON" was added because I don't expect to have time/need to create Views UI for every possible option in the Flot API but figured I would leave an override option open for myself/others that might want to have more control of their Flot charts.
Check out the code on GitHub: https://github.com/rj-steinert/flot_charts-for-views
I have a number of features I want to work on for the Sensor Hub project (http://sensorhub.org/wiki) and will post my "Flot Charts Road Map" on a Wiki page in this group.
Read moreGraphing Data over TIme in a Scatter Plot still unsolved. My notes and the new Flot Timemode Views module.
I'm looking to fulfill the use case of using Views to display a scatter plot of values over time. I've tested many modules but have found none that are able to achieve this. I've filed a number of bug reports and support requests in the process. If anyone can achieve this, I would love it if you would export a Feature module that demonstrates this. In general, it would be great to see maintainers use Feature modules to show what use cases their code does fulfill. I've gone ahead and forked the Views integration for the Flot module and created the Flot Timemode Views module (https://github.com/rj-steinert/flot-timemode-views) but this is still far from ideal. Attached are my notes to save anyone else looking to accomplish this some time. Please feel free to point out problems with my notes.
Read moreProject Quant - presents some powerful tools
http://drupal.org/project/quant seems to present some powerful graphs, that reads of the database. I have been reading and most of the information seems to point to data on a static table - not too useful in my opinion. In that case, do it in excel, get an image and upload it and you will be done with the torture that Drupal chart creation seems to be (for beginners at least).
Read moreCharting and Graphing Modules
Last updated by pixelshrink on Fri, 2017-11-03 13:06
I'll add a formal comparison later, but for now I found it useful to list out some of Drupal's charting/graphing/data visualization options.
http://drupal.org/project/charts Charts (D6/D7/D8)
http://drupal.org/project/visualization Visualization API (D7/D8)
http://drupal.org/project/charts_graphs Charts and Graphs (D6/D7)
https://drupal.org/project/forena Forena Reports & Charts (D6/D7/D8)
http://drupal.org/project/csvchart CSV Chart (D5)
http://drupal.org/project/graphapi Graph API (D7/D8*)
http://drupal.org/project/highcharttable (D7)
jQuery Visualize Plugin: Accessible Charts & Graphs from Table Elements using HTML 5 Canvas
Visualize is a Views style plug-in for implementing the jQuery Visualize charting tool.
jQuery Visualize provides accessible charts providing textual information to non-visual users.
It uses a technique with JavaScript to scrape data from an HTML table and generate charts using the HTML 5 Canvas element.
Try out a demo: http://lakeandweb.com/visualize/
Read more
Der Charts?
I'm having a very difficult time getting my head around charts in Drupal. What is the best module to start with? I've tried them all but can't seem to figure them out. I've been trying to read all I can find, but there doesn't seem to be a whole lot to read. Maybe I'm looking in all the wrong places?
Read moreA new standard in Drupal charting
At DC DrupalCON 2009, a lot of new code came on the scenes:
http://drupal.org/project/views_charts
http://drupal.org/project/views_groupby
http://drupal.org/project/charts_graphs
Session info: http://dc2009.drupalcon.org/session/business-analytics-drupal-views
Video of the presentation: http://www.archive.org/details/DrupalconDc2009-BusinessAnalyticsWithViews
Statistics Pro Released
The module creates statistics with aggregated data. The data will be stored in a new table, which will be updated with a cron run. This statistic module provides statistical results of nodes, comments and users. Those results will be stored even if the access-log or the watchdog table have been deleted. For the presentation the data views and charts module are used. The Drupal core statistics module is used for the raw data (actually it is required for statspro).
Read moreViews support in the charts module released!
http://drupal.org/project/charts
This is the issue from whence it came; http://drupal.org/node/323881
and a picture: http://drupal.org/files/issues/chart_in_views.png
Read more