
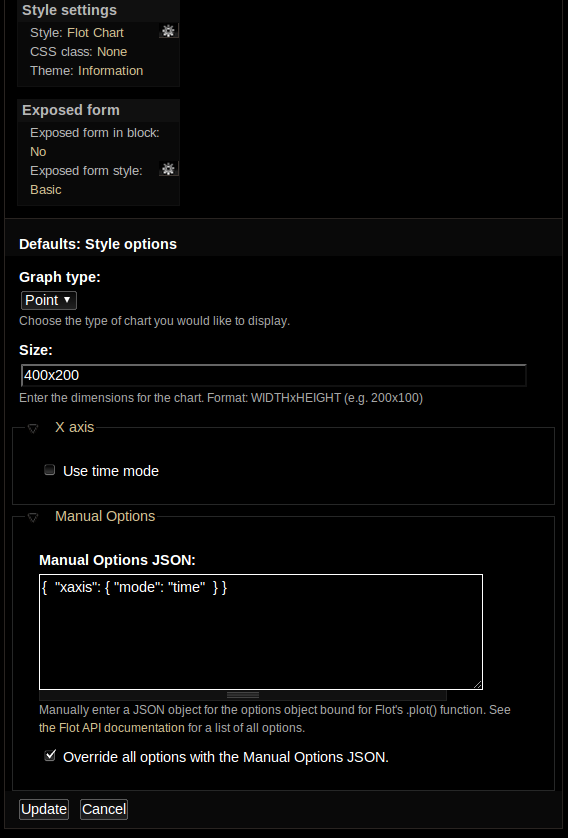
 I decided to drop the flot_timemode plugin and move it in a much more flexible direction. flot_charts has the "Flot Charts" style plugin which now has a cleaner Views UI, an option for setting the x-axis to "mode: time", and for the ultimate in flexibility I've added an option for manually entering the JSON bound for Flot's option parameter in the .plot() function. "Manual Options JSON" was added because I don't expect to have time/need to create Views UI for every possible option in the Flot API but figured I would leave an override option open for myself/others that might want to have more control of their Flot charts.
Check out the code on GitHub: https://github.com/rj-steinert/flot_charts-for-views
I have a number of features I want to work on for the Sensor Hub project (http://sensorhub.org/wiki) and will post my "Flot Charts Road Map" on a Wiki page in this group.
Comments
Url not working
https://github.com/rj-steinert/flot_charts-for-views