
Recently, I was asked to pull together some metrics which would help illustrate the current health of the automated testing infrastructure, and provide a baseline by which we could monitor it over time ... and I thought I'd share some of those findings here.
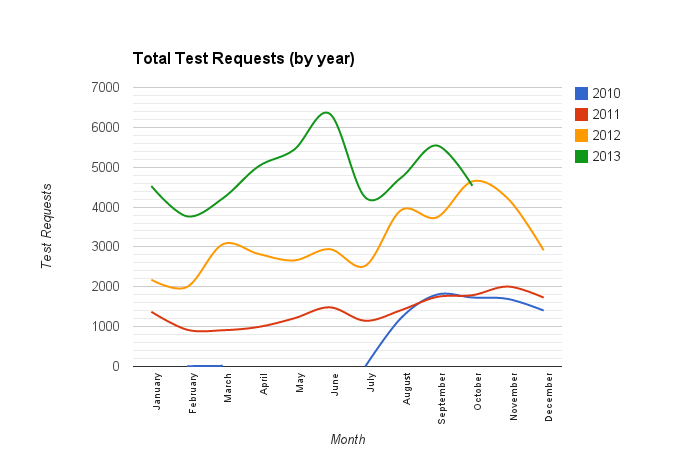
The first graph shows how testbot utilization has grown over time, from a steady-state count of around 1000 tests per month in the first half of 2011, doubling to 2000 tests per month in January 2012, and reaching a peak of over 6400 requests in June of 2013.
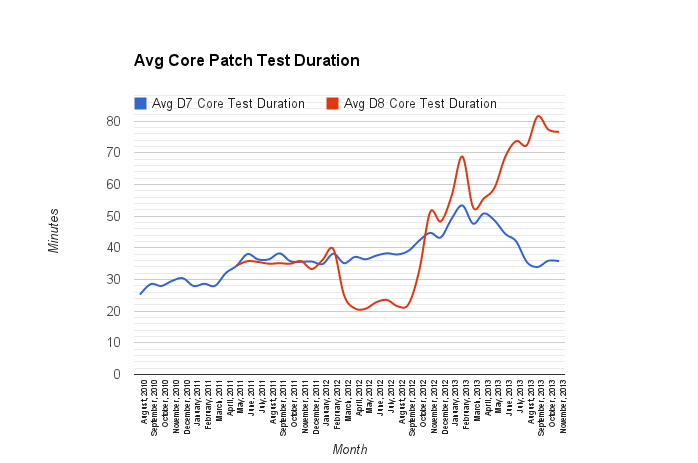
The second graph shows the average duration of D7 and D8 patch testing runs. Note that the average D8 test run duration peaks around 80 minutes per test, nearly four times as long as the 22 minute average in mid-2012. Combine this with the increased number of requests over the same period, and we have increased the capacity demands on the system by between 500% and 800% over the last 24 months.
The third graph demonstrates something I'm sure most folks already know, in that patches had to endure some excessively long wait times in the testing queue at various points in the last 18 months ... with the largest spikes corresponding with the various Drupalcon sprint days.
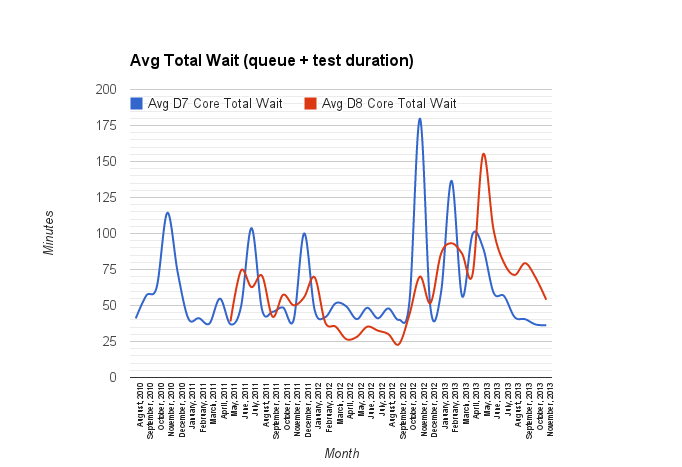
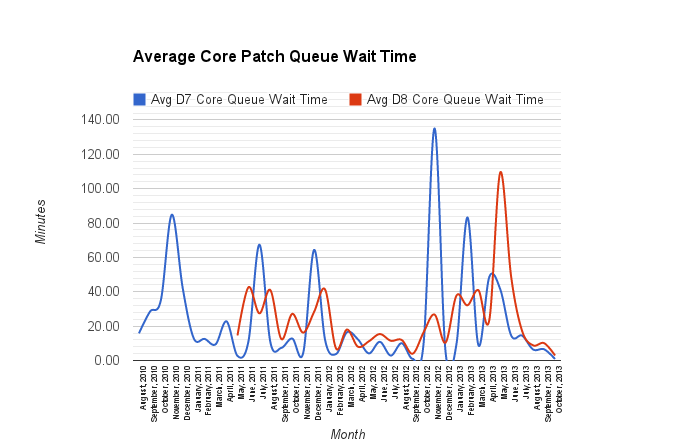
The one thing thing I would like to point out on this graph, however, is that since July, the average total wait time for D8 core patches is about equal to the test run time. After hitting an all-time high this summer, the average waiting time for patches in the queue has dropped nearly to zero, as confirmed in the next chart:
The test duration times above only include tests which are able to complete the test run, as tests with environmental failures would wrongly skew the results towards shorter durations. The following chart gives the number of tests which failed due to an environmental issue within the testing infrastructure itself:
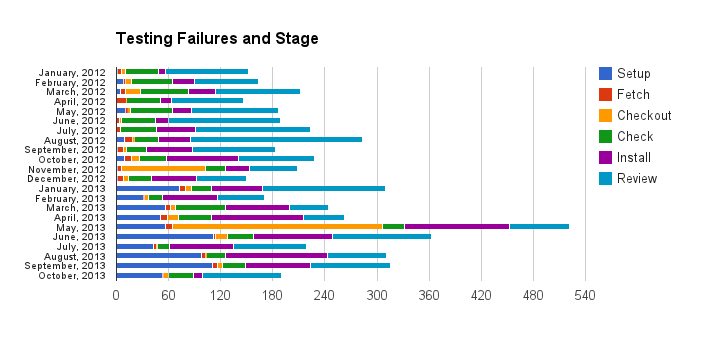
Given that requeuing a failed test wipes out the data used to generate these metrics, the absolute values here may be severely underestimated ... but the key point to take away from this chart is that, while the nature of the failures has changed, the volume of environmental failures experienced on the system has not risen in proportion with the increased test request demands being placed on the system (with the obvious exception of May/June, which corresponds with the post-security incident rebuild of the underlying infrastructure and supporting systems.
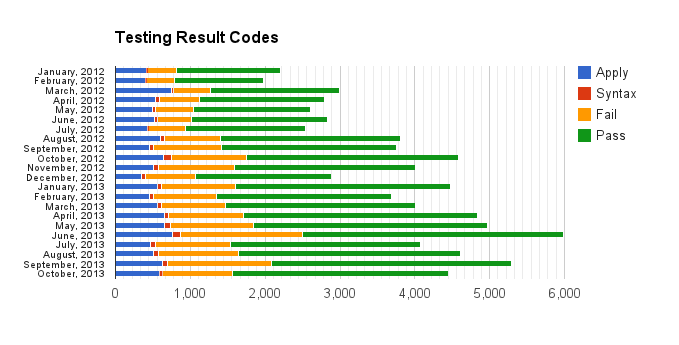
And finally, just for interest's sake, the last chart illustrates the ratio of test passes, failures, syntax check failures, and 'failed to apply patch' results reported by month across the testing infrastructure. The 'failed to apply' stat may seem high, but consider that this also includes re-test attempts of old patches, which fail to apply and result in a new patch file (and thus brand new test instance).
| Attachment | Size |
|---|---|
| total_requests.png | 20.22 KB |
| core_patch_test_duration.png | 19.1 KB |
| core_patch_total_wait.png | 24.07 KB |
| core_patch_queue_wait_times.png | 24.88 KB |
| testing_failures_stage.png | 14.62 KB |
| testing_result_codes.png | 12.71 KB |
Comments
That's all super interesting stuff! Thanks, Jeremy. :-)
That's all super interesting stuff! Thanks, Jeremy. :-)
Test duration
The test duration graph is very interesting.
First the switch to testing profile, which cut it in half, then it suddenly exploded.
I think the second drop there is the plugin directory parsing (e.g. parsing all entity types of all modules instead of just enabled), took me quite some time to fix that. And then it immediately exploded again :(
What I don't understand is why D7 would get faster. Could that be due to the faster, non-virtual testbots? That would mean that the 8.x numbers are even worse than it looks.
D7 speed-up
The introduction of the community-sponsored testbots definitely brought down the average test time, which is a plausible explanation for the D7 test runs getting faster ... OSUOSL also did some rebalancing on our the Supercell instances which host the testbots, as one of the hosts was much more heavily loaded than the other (thus affecting performance).
That said, it did only come down to it's long-term average across the previous years.
Fascinating data! Thanks for
Fascinating data! Thanks for sharing!
Smart Drupalistas!
I'd have never thought that we write more passing patches than failing ones. That is very encouraging!
(Also intimidating, as I'm pretty sure that statement doesn't hold for myself... :-))
Nice test infra metrics.
Nice test infra metrics. Thanks for sharing.
I'm also curious about # of test request per issue, issue lifetime etc but that's another kind of statistics.
Fascinating data! Thanks for
Fascinating data! Thanks for sharing!
Cheers,
Rachit Gupta
Founder DrupalMumbai, DrupalCAP.org
rachit.gupta@drupalmumbai.org
Relates to..
Thanks! How long did it take you to put this together? I'm impressed.
Are we using this data to help give information to other discussions?
Maybe budget, or deciding priorities?
Is there a discussion somewhere that is looking at reducing, say the test durations?
Do we know how long a "mega-test" would take to run all the d8 versions of contrib agains d8 core head?
Cathy Theys