
First off, thanks in advance for any comments/recommendations.
Over the past few months I have been working on performance tuning a D7 site that includes Drupal commerce. Using NewRelic, I was able to determine that menu_tree_check_access() was being called on every menu item with the Taxonomy Menu Block. I quickly replaced the menu block with Views that does the same thing as the menu block did, except much faster...
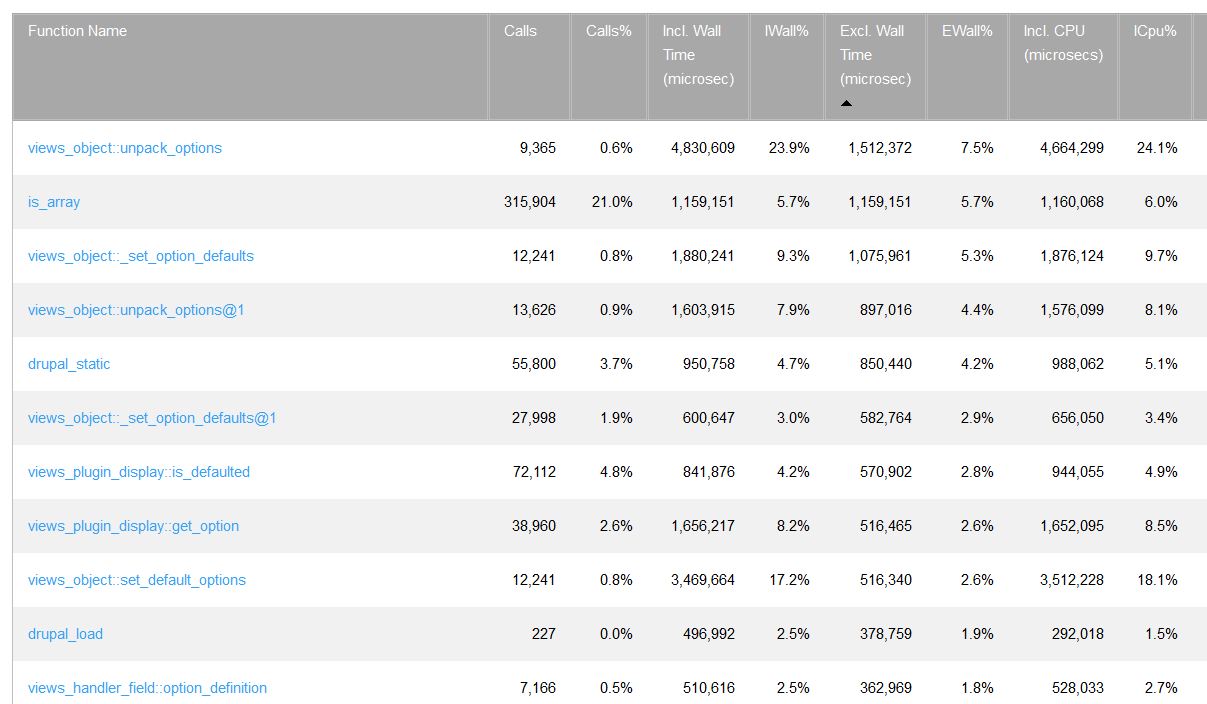
That was the big trouble maker that I was able to remove and have a serious positive impact. Also working with hierarchical taxonomies was slow and painful and found that Taxonomy Edge module was able to help me out there. Now I've gotten to the point where all my views which are loaded on /taxonomy/term/% run great while testing them in views admin, but the actual finished term page is taking 10 seconds plus to generate first time hits. I was able to work around this with the ajaxblocks module, and letting varnish cache the pages once generated.... but I am having trouble identifying what else is running on the /taxonomy/term/% pages that I can focus my attention on. If I remove all the views from the page, it still takes 9 seconds to render - and running all the views on the admin preview take ms. So my thought process is that the problem lies outside of views, and at a higher level, however looking at a XHProf sorting by EWT (see attached) makes me think otherwise.
The tools available to me are currently:
NewRelic
XHProf+Mongo
X-Debug+Cachegrind+Webgrind/WinCachegrind
I am running profile tests on 32 bit ubuntu vm with with no other activity.
Q: Is there something else that could help identify that biggest time sink for me to focus my attention?
| Attachment | Size |
|---|---|
| XHProf.jpg | 99.83 KB |
Comments
Similar issues
We've seen sites that have bottlenecks on taxonomy/term/% pages, but not as bad as what you have there.
This is a Drupal 6.x site, where the node table has 131,160 rows, term_data 25,609, and term_node has 250,055 rows. This relatively large data set for taxonomy rows is due to using free tagging terms.
Note: in Drupal 7.x the table names are different (taxonomy_term_data and taxonomy_index respectively).
This is not using views, just core Drupal, so it is different.
The slow queries are:
SELECT DISTINCT(n.nid), n.sticky, n.title, n.createdFROM node n INNER JOIN term_node tn0 ON n.vid = tn0.vid
WHERE n.status = 1 AND tn0.tid IN (8193) ORDER BY n.sticky DESC, n.created DESC LIMIT 0, 10;
Which takes 1.05 seconds.
SELECT COUNT(DISTINCT(n.nid))FROM node n INNER JOIN term_node tn0 ON n.vid = tn0.vid
WHERE n.status = 1 AND tn0.tid IN (4236);
Which takes 0.8 seconds. Both adding up to 2 seconds per page load.
We found that Google's crawler aggravates the issue by adding arguments like: "page=" or "from=" and that makes the URLs not unique, and therefore not cached.
Part of why Google was so aggressive was implementing a CDN. Once you do that, Google disables your ability to slow down the crawl rate in Webmaster.
We did not want to refresh the pages too often, so we added to Varnish a custom.vcl file with this in it:
sub vcl_fetch {if (req.url ~ "^/taxonomy/term/" &&
req.url ~ "page=" &&
req.http.Cookie !~ "(SESS)") {
set beresp.ttl = 48h;
set beresp.grace = 72h;
}
}
For your situation, I recommend you continue to use Xhprof, and look into why the number of calls are so high. 315K for is_array() is just too much.
You need to look into where these calls are coming from.
Perhaps it is in the theme layer when the view is being rendered or something.
Or maybe you did enabled views caching for query result only and not rendered output?
Or you are doing user_load() or node_load() or other table lookups in the views* tpl.php for each field?
Drupal performance tuning, development, customization and consulting: 2bits.com, Inc..
Personal blog: Baheyeldin.com.
Views settings
If you go to admin/structure/views/settings, under Live Preview Settings, check these boxes.
It will show you the "Query execute time" and "View render time".
Drupal performance tuning, development, customization and consulting: 2bits.com, Inc..
Personal blog: Baheyeldin.com.
re:menu_build_tree
Thanks for the insight @kbahey
Follow up to the first reply...
In views/includes/base.inc
views::unpack_options() first thing in the function is a call to is_array()
function unpack_options(&$storage, $options, $definition = NULL, $all = TRUE, $check = TRUE, $localization_keys = array()) {if ($check && !is_array($options)) {
return;
}
For stats we have:
7K+ product nodes
23K product variants
1.5K taxonomy terms
16K url aliases
X-Debug+cachegrind shows that the lion share of the calling of that function is coming from
views/includes/base.inc
views/includes/handlers.inc
views_handler::init() -> unpack_options()
On further inspection of cachegrind, the handler that is calling all of that, is coming from (shortened)
drupal_get_breadcrumb()->menu_get_active_trail()->menu_build_tree()
Which that shouldn't be called again, because there is a cache->get(). So I'm going to look into why the cache is failing to be saved/returned. I'll report back tomorrow.
Aha
includes/menu.inc
menu_tree_page_data() is failing to save the cache of the built tree so it is having to recreate it each time it is called. I have a strong feeling once I fix this, it will easily shave 75% of the time off this total processing time.
But that will have to wait till tomorrow...tbc
Confirmed - 60% of the total processing time
So 60% of the time the process is being wasted in rebuilding the menu and underlying function calls. Mostly in
menu.inc
menu_tree_check_access()
_menu_tree_check_access()
_menu_link_translate()
So this patch improves successive page loads once the menus are cached for that user.
@@ -1351,11 +1351,20 @@ function menu_tree_page_data($menu_name, $max_depth = NULL, $only_active_trail =
* A fully built menu tree.
*/
function menu_build_tree($menu_name, array $parameters = array()) {
- // Build the menu tree.
- $data = _menu_build_tree($menu_name, $parameters);
- // Check access for the current user to each item in the tree.
- menu_tree_check_access($data['tree'], $data['node_links']);
- return $data['tree'];
+ // Per user menu caching
+ global $user;
+ $cid = 'menu_build_tree='.$menu_name.':user='.$user->uid;
+ $tree_cache = cache_get($cid,'cache');
+ if($tree_cache){
+ return $tree_cache->data;
+ } else {
+ // Build the menu tree.
+ $data = _menu_build_tree($menu_name, $parameters);
+ // Check access for the current user to each item in the tree.
+ menu_tree_check_access($data['tree'], $data['node_links']);
+ cache_set($cid,$data['tree'],'cache',CACHE_PERMANENT);
+ return $data['tree'];
+ }
}