If you want to make charts automatically from a Table in a Drupal page...
IF YOU LIKE the following auto-charting program: Shown working on:
http://mynichecomputing.org/drupal6/content/demo-auto-table-graphs-funct... and
the screen shoot of a similar auto-graphing page (this one with the Pie chart),
http://mynichecomputing.org/visualize/imageView.html
and if http://mynichecomputing.org/autoChartsDir.html and
http://mynichecomputing.org/autoChartsDir2.html make sense to you.
THEN
To make the program work on YOUR pages:
Download: http://mynichecomputing.org/shared/visualize.zip
and unzip it. Upload the resulting visualize folder to your
Module for using Fusioncharts
I have created a very simple module that is a hook into FusionCharts. I did this because I realized that the existing modules don't seem to be supported that well and because they also limit the functionality you can use from FusionCharts.
My module really requires that you build another module to access it, so it is pretty simplistic, but I'm wondering if anyone is interested in it. If so, I will look into submitting it to the Drupal repository. Please let me know what you think...
Read more
New "Flot Charts" Style Plugin for Views lets you manually enter JSON options
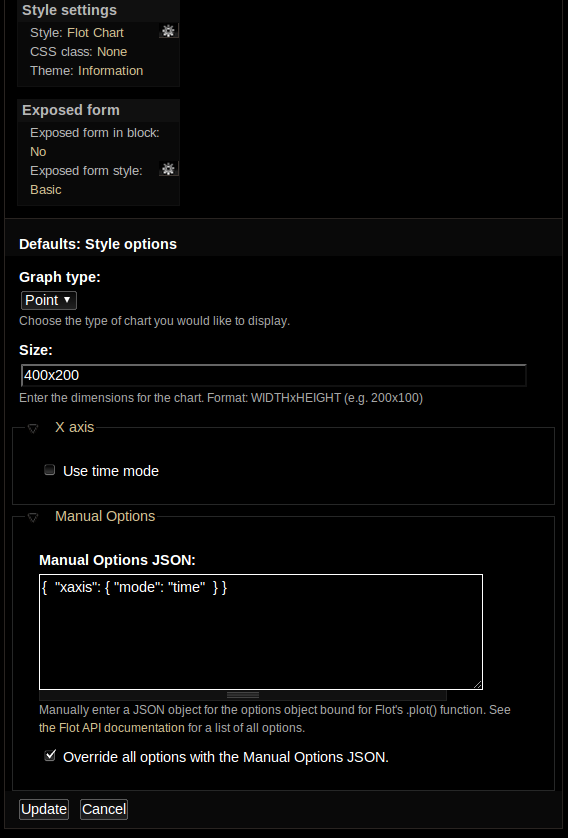 I decided to drop the flot_timemode plugin and move it in a much more flexible direction. flot_charts has the "Flot Charts" style plugin which now has a cleaner Views UI, an option for setting the x-axis to "mode: time", and for the ultimate in flexibility I've added an option for manually entering the JSON bound for Flot's option parameter in the .plot() function. "Manual Options JSON" was added because I don't expect to have time/need to create Views UI for every possible option in the Flot API but figured I would leave an override option open for myself/others that might want to have more control of their Flot charts.
Check out the code on GitHub: https://github.com/rj-steinert/flot_charts-for-views
I have a number of features I want to work on for the Sensor Hub project (http://sensorhub.org/wiki) and will post my "Flot Charts Road Map" on a Wiki page in this group.
Read moreGraphing Data over TIme in a Scatter Plot still unsolved. My notes and the new Flot Timemode Views module.
I'm looking to fulfill the use case of using Views to display a scatter plot of values over time. I've tested many modules but have found none that are able to achieve this. I've filed a number of bug reports and support requests in the process. If anyone can achieve this, I would love it if you would export a Feature module that demonstrates this. In general, it would be great to see maintainers use Feature modules to show what use cases their code does fulfill. I've gone ahead and forked the Views integration for the Flot module and created the Flot Timemode Views module (https://github.com/rj-steinert/flot-timemode-views) but this is still far from ideal. Attached are my notes to save anyone else looking to accomplish this some time. Please feel free to point out problems with my notes.
Read more
Graphing?
Hello all,
I was wondering what the current status of graphing/monitoring utilities & pantheon is - I've done a bit of searching, and all I've found is a mention by Greg Coit in June that munin was probably going to be chosen. I'm quite familiar with munin, and have started to wrap my head around bcfg2. (we mostly use puppet at our org) So, I'd like to contribute, but wanted to make sure I wasn't going to be duplicating any work that's already been done. We're looking to deploy a large multisite on pantheon where I work in the next year, and good monitoring will be essential...
Read more